
Hot Briquetted Iron (HBI), Steel’s Most Versatile Metallic: Part 2 – Sourcing Merchant HBI

Robert HunterRaw Materials Consultant
Articles by Robert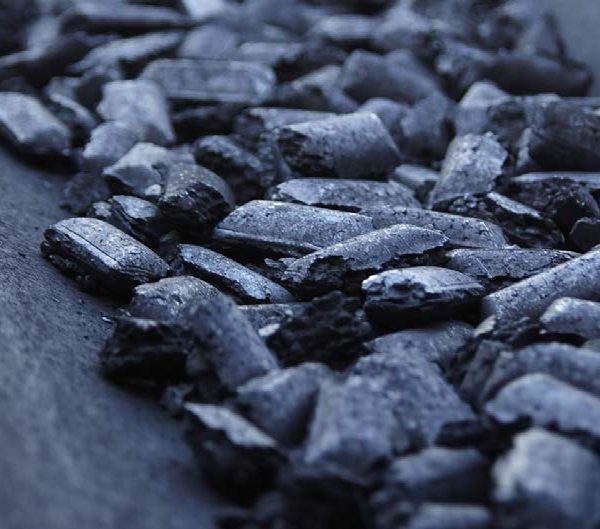
EDITOR’S NOTE:
This article is the second in a series that will appear in DFM throughout 2018. In Part 1, we went back to the basics and described what is hot briquetted iron (HBI), what makes it such a useful source of steelmaking metallics, how it became part of MIDREX® direct reduction technology and where HBI plants are located. Part 2 in the series will look at where HBI can be sourced today and considerations for where additional capacity could be built in the future.
Introduction
Merchant HBI allows those who do not own and operate their own plant to purchase
material in the open market. The motivation for obtaining HBI from a merchant source can be that local prices for the primary inputs for producing it – iron ore and natural gas – are prohibitive and the steelmaker wants the flexibility to purchase HBI in specific quantities on an as-needed basis.
Which locations are best suited for producing and selling HBI as a merchant product? There are three primary considerations related to merchant HBI: iron ore, natural gas, and steelmaking. Since iron ore and natural gas are the primary inputs for manufacturing HBI, we need to look at where they are produced in relation to the steelmaking plants that could use the product.
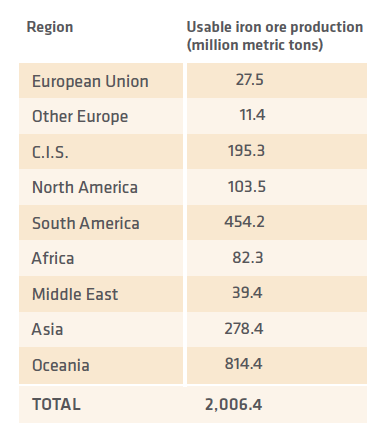
TABLE I.
Regional production of iron ore (year: 2016) Source: Steel Statistical Yearbook 2017, World Steel Association
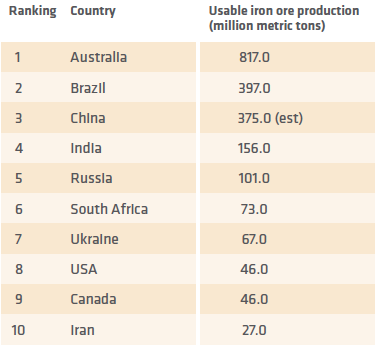
TABLE II.
Top 10 countries producing iron ore (year: 2015) Source: CIA World Fact Book, 2017
IRON ORE
Riding on the back of the phenomenal boom in steelmaking within China, world iron ore production surpassed 2 billion tons per year (B t/y) earlier this decade, which is up by more than 2-to-1 since 2000.1 (see TABLE I). Since passing the 2B t/y mark, growth has slowed and output has remained relatively level, as demand is now being satisfied. TABLE II shows the major iron ore producers in 2015.
Roughly 80% of all iron ore – about 1.6B t/y – is traded internationally, and approximately 90% of this trade is carried in ocean-going vessels. Of this seaborne trade, more than three-fourths originates in Australia, Brazil or India.
Due to China’s extreme scarcity of good quality iron ore, massive amounts are imported, today exceeding 1B t/y. The producers of the ore from the huge reserves of Australia’s Pilbara, which are the closest high-grade ores that occur in large quantity, have benefitted from China’s demand, growing in output by more than 400% since 2000. Australia now exports over 800 million tons per year of ore, mostly to China, making it by far the world’s number one producer and number one exporter of iron ore.
Brazil, the second largest iron ore producer, also has experienced significant growth. Brazil currently produces about 450M t/y of ore, of which about 85% is exported. To provide an historical perspective, the entire world never produced over 400M t/y tons of iron ore until sometime in the 1950s.
After Australia, Brazil and China, India is the next largest producer of iron ore, but a strong clampdown on illegally (unpermitted) production and transport curtailed production in recent years and has enormously decreased exports.
Footnote [1] – A correction has been made to equate Chinese iron ore to the typical world standard. Even though China produces about 60% of the world’s iron, the country has almost no reserves of good quality ore. In fact, the quality of this ore is so low that it yields only about 25% as much iron as most of the ore produced and traded in the rest of the world. More recently, as mining/processing capacity for higher quality ores has come on line in Australia, most of China’s mines have been closed in favor of the lower cost Australian ores.
As Figure 1 shows, the great majority of the seaborne iron ore originates in the southern hemisphere, primarily Australia and Brazil, and is consumed in the northern hemisphere, primarily by China, Japan, South Korea, and Europe.
NATURAL GAS
When we consider natural gas, the ranking of countries is not so straightforward, shifting somewhat on whether we are evaluating production, reserves or supply fields.
TABLE III shows the top 10 natural gas producing countries in 2015 (except China, which is 2016).
The top 10 ranking of natural gas reserves is shown below in TABLE IV. To complete the natural gas trifecta, TABLE V shows the 10 largest non-associated natural gas fields, six of which are in Russia/CIS.
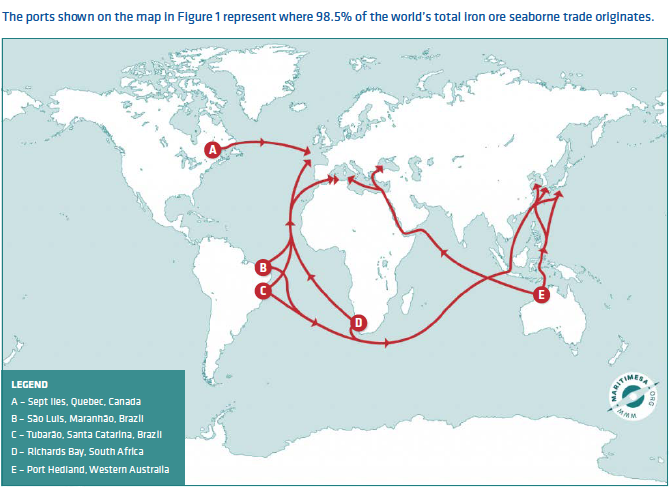
FIGURE 1.
Major seaborne iron ore trade routes (Source: www.Maritimesa.org)
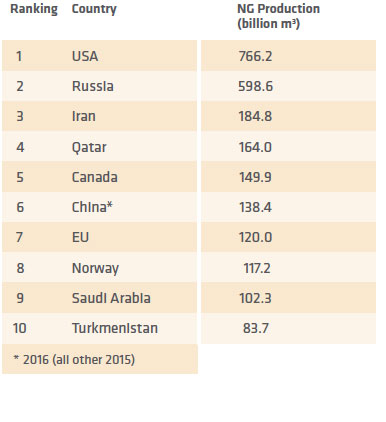
TABLE III. Top 10 natural gas producing countries (years: 2015, 2016) Source: CIA World Fact Book, 2017
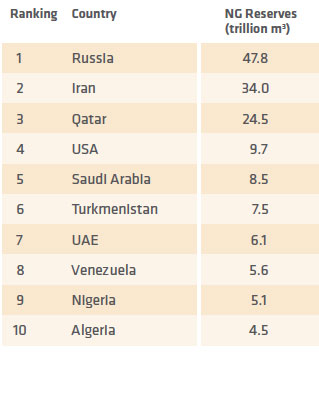
TABLE IV. Top 10 natural gas reserves by country (years: 2015, 2016) Source: CIA World Fact Book, 2017
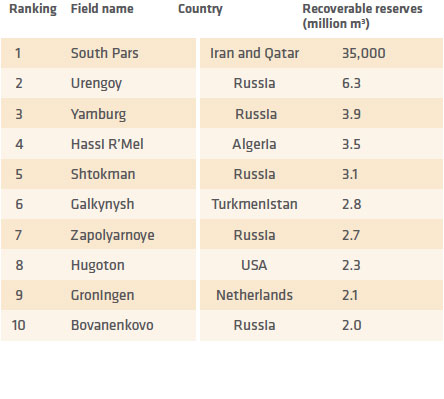
TABLE V. Largest non-associated natural gas fields (1,000 m3 and more) Source: "Global Natural Gas Reserves - A Heuristic Viewpoint," IPC Petroleum Consultants, 2017
How does all this data relate to locations for producing HBI? It can best be used to identify countries with natural gas currently available (production) for HBI production and those with resources that could be developed (reserves) and those with undeveloped fields (possible).
Countries with the largest current natural gas production would be considered the leading locations for a merchant HBI plant. In fact, the top five – USA, Russia, Iran, Qatar and Canada – all have direct reduction plants, and merchant HBI plants already are operational in USA and Russia. However, several other countries in Middle East/North Africa (MENA) and the Commonwealth of Independent States (CIS), as well as Australia, Azerbaijan, China, India, Indonesia, Mexico, Nigeria, Norway, Bolivia, Brazil and Venezuela are significant natural gas producers. Figure 2 shows the major natural gas production countries in 2015-16
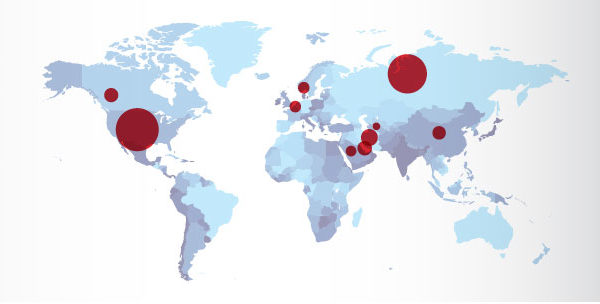
FIGURE 2.
Where natural gas is produced - by country (Source: CIA World Fact Book, 2017 - See TABLE III for production figures)
BEST CONDITIONS FOR MERCHANT HBI
Looking at Figures 1-3, we can see that there are several locations where iron ore, while in transit from mine to steelworks, could be converted into HBI at coastal plants using the natural gas-based MIDREX® NG Process. Among these sites are the southern coast of Brazil, the Caribbean Sea/Gulf of Mexico basin (Venezuela, Trinidad & Tobago, and US Gulf Coast), West Africa (Nigeria south to Angola), North Africa (Algeria to Egypt), the Arabian Sea, Western Australia, and the Malay-Indonesian archipelago. Other possible locations are the North Sea gas fields for ores moving to Western Europe, and even though landlocked, the Siberian gas fields are quite convenient to the Russo-Ukrainian ore deposits.
Clearly, many of these locations correspond to existing HBI plants: Libya, Malaysia, Russia, Venezuela and the USA (see Figure 4). The best scenario is when sufficient quantities of competitively priced natural gas and iron ore are available in reasonable proximity to an ocean port. However, countries with natural gas that are along the seaborne trade routes for iron ore are possible locations to economically implement a merchant HBI operation.
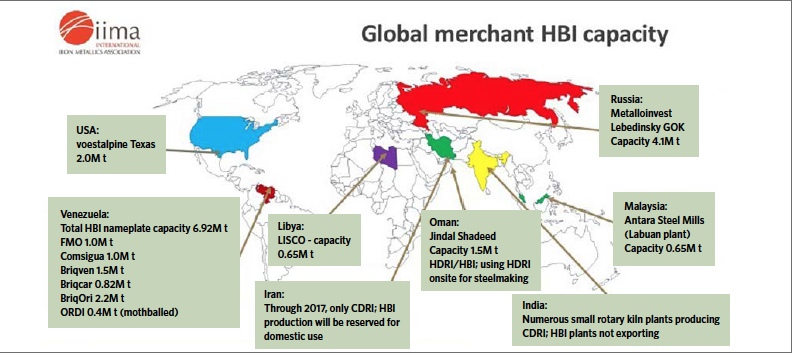
FIGURE 4.
Global merchant HBI capacity
COMMISSIONED HBI CAPACITY VS. PRODUCTION
There are more than 25M t/y of HBI capacity installed or under construction worldwide; 18 plants using MIDREX® technology, 3 HYL/ENERGIRON®, and one each FINMET®, CIRCORED® and FIOR®. However, much of that capacity is not available as merchant HBI, either because of owner decision (in the case of dual product plants), operational issues (natural gas price/availability, oxide pellet shortage, etc.) or geopolitical situations that restrict some or all of production. See TABLE VII. To make a more accurate accounting of how much installed HBI capacity currently is available for merchant trade, we must start by accounting for the dedicated HBI plants (i.e., those whose sole product is HBI) that were idle/limited in 2017:
- MIDREX® HBI plants in Venezuela (FMO, COMSIGUA and Briqcar), with a total installed capacity of 2.82M t/y, are severely limited due to the general economic collapse in the country. Their output last year only averaged 21%of capacity.
- LISCO 3 (0.65M t/y) is operating occasionally in the wake of the civil war in Libya.
- Briqven, BriqOri, Circored, and Operaciones RDI, which represent 4.6M t/y of installed capacity, were either limited or idle in 2017. The first two operated at an average of about 12% of capacity and the latter two have not operated in over 20 years.
- Iranian steel authorities have reserved HBI production for domestic steelmaking.
Then, we must include currently installed plants that have HBI capacity but only utilize it for merchant trade when the adjacent steel mill does not require iron units:
- Essar Steel made the decision to switch entirely to HDRI production (3.82M t/y) to feed their steelmaking furnaces.
- Qatar Steel has increased internal usage of CDRI (2.5M t/y) and rarely makes HBI.
- Jindal Shadeed (1.5M t/y) is using its HDRI onsite now that its steel mill is operational.
- Lion DRI (1.54M t/y) is closed.
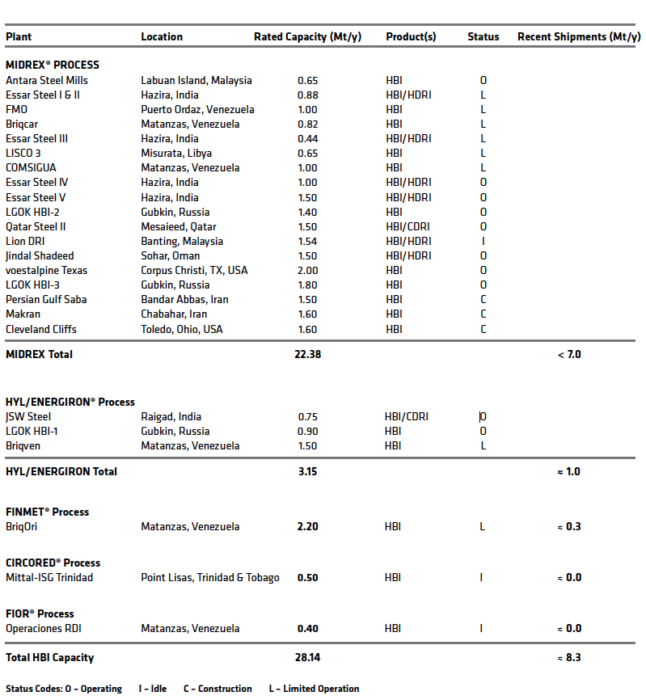
TABLE VII.
Installed HBI capacity by process (primary or secondary product) and recent shipments
CONCLUSION
The amount of HBI available to the merchant market is extremely limited. Therefore, as shown in TABLE VII, almost 20M t/y of HBI capacity either installed or under construction, currently are not available for merchant sale. So arguably that leaves the world with not quite 8.5M t/y of reliable merchant HBI capacity, which ironically is less than the market forecast in 1984 by Midrex (9.63M t/y).
To meet even a conservative estimate of potential demand, additional HBI plants need to be built. Therefore, investing in natural gas-based direct reduction plants, either directly or through long-term supply contracts, in strategically located sites around the globe is now feasible. For instance, the plant owned and operated by voestalpine Texas LLC is located at a coastal site on the Gulf of Mexico, and uses regionally available natural gas and iron ore from the regular Brazil-USA trade route to make HBI primarily for voestalpine’s steelmaking operations in Austria.
Midrex has been the leading supplier of HBI technology since the mid-1980s, and recently added 3.8M t/y of HBI capacity (voestalpine Texas, 2.0M t/y; and LGOK HBI-3, 1.8M t/y). Cleveland-Cliffs, Inc. broke ground for a 1.6M t/y MIDREX® HBI Plant earlier in 2018. The location of the brownfield site at the Port of Toledo (Toledo, Ohio, USA) is in proximity to several future customers and has logistics advantages including local gas availability, access to the Minnesota Iron Range ore, and service by multiple rail carriers.
As worldwide merchant demand for high quality metallics continues to grow, HBI production must keep pace. Midrex will continue its leadership through innovation, improvement and implementation of reliable technology solutions for the global steel industry.
EDITOR’S NOTE:
In the next issue of DFM, we will look at what defines HBI quality and how it is determined.
Related Reading
 Mar 25, 2026
 Feb 04, 2026