
Adapting to Raw Materials Challenges: Part 2 – Operating MIDREX Plants With Lower Grade Pellets & Lump Ores

John LinklaterGeneral Manager - Midrex Technologies Gulf Services FZCO
Articles by John
INTRODUCTION
This is the second article in a two-part series exploring the options for using lower grade oxide pellets or lump ores to operate a MIDREX® Plant. Part 2 presents a strategy for increasing the percentage of lump ore in the feed mix of a MIDREX Plant, which involves MIDREX Remote Professional Services (RPS). A step-by-step case study documents the method that was used to adapt to an alternative raw materials strategy and the results that were achieved. Part 2 concludes with a series summary.
In Part 1, we looked at how the chemistry of the iron oxide pellets affects the use of DRI/HBI in the EAF and the BF.
PART 2:
IMPLEMENTATION STRATEGY
MIDREX Remote Professional Services (RPS) has collaborated with clients in successfully increasing the lump ore in a MIDREX Shaft Furnace. Prior to introduction/procurement of lump ore, it is critical that the ore is tested in the laboratory or with a basket test in the MIDREX Shaft Furnace. RPS is involved with and the following evaluations are recommended:
- Evaluate the type of lump – some lump ores rupture during the transition from Fe2O3 to Fe3O4, generating excessive fines and chips.
- Evaluate size distribution – simulate the furnace conditions with Midrex proprietary software to determine the maximum reformed gas flow attainable with the different blends. The following will be evaluated:
- Maximum flow to cause fluidization with different feed mixes – this requires the feed mix size distribution.
- Furnace delta P with increased flow/various feed mixes – increased fines generation assumed from results of standard and non-standard tests. The following equipment sizing needs to be evaluated to evaluate the effects on the process:
- System pressure – furnace dynamic seals to be checked with increased system pressure.
- PG compressor sizing – if the process is PG compressor limited, what production can be achieved or what can be done to increase compressor output.
- Seal gas system sizing – includes compressors, seal gas dryer, BSG compressor etc. If the system pressure is increased, flow to the seal legs requires an increase.
- Super data runs to predict process changes will maintain product quality.
- Evaluate the burden feeder speed adjustments required with the various blends due to density changes – these will be altered as the % lump ore is increased and the % DR-grade pellets is reduced.
- Process changes required prior to introduction of ore i.e. bed temperatures, etc.
- Reducibility testing of the lump ore.
Once the implementation of lump ore has been evaluated, it is critical to ensure the current plant operation is stable with a low standard deviation of product quality prior to introducing the lump. Introducing a different feed mix into an unstable plant will result in further instability and wider swings in product quality.
CASE STUDY
In the case study below, the steps after the evaluation have been outlined. This is plant-specific and each plant will differ.
STEP 1 - STABILIZING THE OPERATION
As stated previously, before introducing lump ore into a feed mix, it is essential that plant operation is stable. Changing feed mix always carries the risk of introducing instability. In this case study, there were several areas that needed to be addressed prior to introducing the lump ore. These have been listed to highlight the importance of preparing the plant to be successful in the introduction of the new feed mix.
Bed Temperature
A stable plant would typically have a maximum bed temperature variation of approximately 10°C. The study plant had furnace bed temperatures, with a variance of 85°C. With the MIDREX Shaft Furnace separated into segments, it can be seen how the temperatures in each segment differed, showing hot and cold zones (Figure 1). This can be an indication that there are bustle ports blocked farthest from the inlet, where the bustle gas velocities are the lowest. This was resolved by inspecting and clearing all the bustle ports during the following turn around. In addition, the velocities at the nozzles were analyzed prior to the turnaround and recommended – 25% of the nozzles be blanked off to increase gas velocities into the bed.
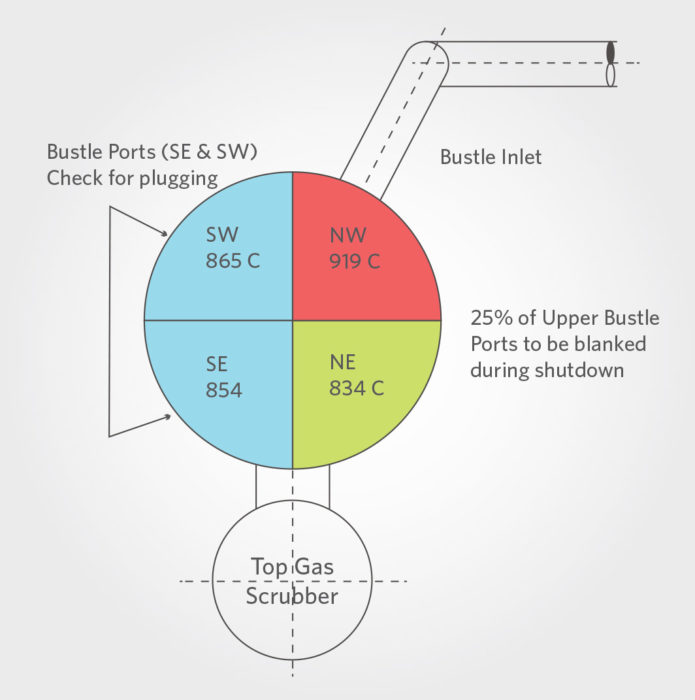
FIGURE 1.
Furnace Bed Temperatures
Bustle Temperature
In a MIDREX Plant, it is preferable that the control of the bustle temperature is operated in automatic mode. The operating criteria of the bed temperature in combination with the process gas flow/ton ratio is used to maintain the bed temperature at an optimum and stable value (+/- 10°C) to ensure product quality and process stability. Automatic bed temperature control was not possible in the study plant due to failed thermocouples not providing the bed temperature feedback that was required to run in automatic. It was recommended these be repaired during a turnaround.
Discharge
The discharge rate for the product was erratic and showed significant fluctuations. The following process parameters in the furnace were being affected due to the swings in the discharge:
- Bustle temperature
- Top gas temperature
- System pressure
- Top gas fuel
- Roof temperature
Discharge variations shown in Figure 2 resulted in an unstable process, and therefore unstable quality. An investigation showed the furnace product discharge feeder capacity to be undersized due to production increases over time. This resulted in a lack of control in the feeder that produced an unstable discharge. It was recommended to replace the discharge feeder with one having a larger capacity, which would guarantee operating fluctuations of less than +/-2 TPH for discharges up to 40% above the current average production rate.
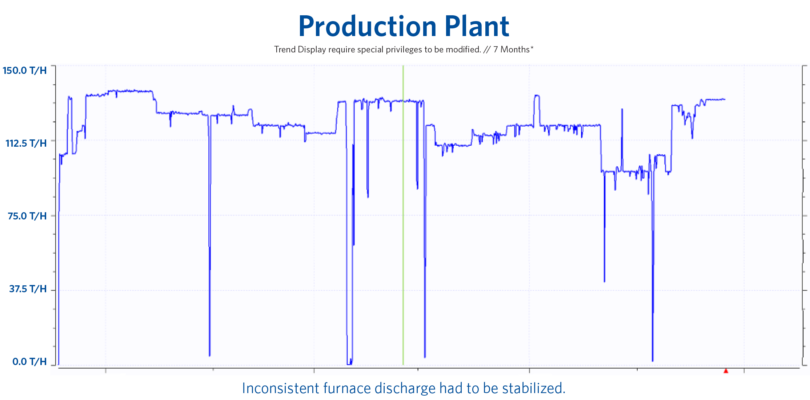
FIGURE 2.
Product Discharge1
Feed Mix
Changing the feed mix can introduce some process instability. The study plant was currently blending its feed mix from three feed bins. Each bin was charged with a different raw material supplier. Feed bin discharge rates were examined to ensure there was a consistent feed from each bin. It was found that the feed mix was constantly changing. Midrex worked with the client in assessing the optimal feed mix blend using fluidization software to ensure the optimal mix for the available material was selected. Once this was determined and the feed mix more consistent, introducing the lump ore in stages could be planned.
The trend in Figure 3 shows the inconsistent feed mix. You can see significant fluctuations in the discharge from each bin. Each feed bin discharge rate should be in a steady state. A fluctuating discharge rate results in constant production changes making it difficult to maintain a consistent product and process, such as the NG/ton product ratio, etc.
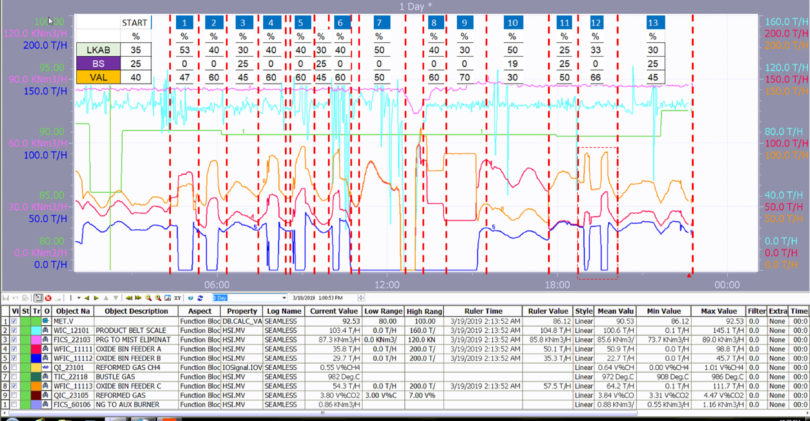
FIGURE 3.
Inconsistent Feed Mix Trends1
Burden Feeders
In a MIDREX Plant, the burden feeders are designed to promote uniform movement of the bed and to reduce the size of clusters formed during process upsets. Experience shows that ensuring the burden settings, such as the angular speeds relative to the material density are critical in ensuring a stable furnace operation. The burden feeder speeds were evaluated and then adjusted. It is important to note that excessive burden feeder speeds can result in higher fines generation as a result of material being crushed.
Reformer Temperature Control
Reformer temperature control is fundamental to ensure the process is stable. The reformed gas quality, gas volume, product quality, and NG consumption are all affected when the reformer temperature control is not precise. It was recommended the reformer temperature be stabilized by adding natural gas to the main burners. This would allow fine roof temperature adjustments are made with natural gas to main burners, which is according to Midrex design. The natural gas has a stable heating value relative to the top gas fuel, where the heating value can fluctuate. This allows the necessary adjustments to be made to the temperature with minimal natural gas flow adjustments. This would stabilize the process and quality.
STEP 2 - CONTROL PRODUCT QUALITY
Once many of the steps covered were implemented, the results were seen in the product quality (Figures 4 and 5). Ultimately, the process stability is measured by the product quality standard deviations. Once at a satisfactory level, lump can be introduced.
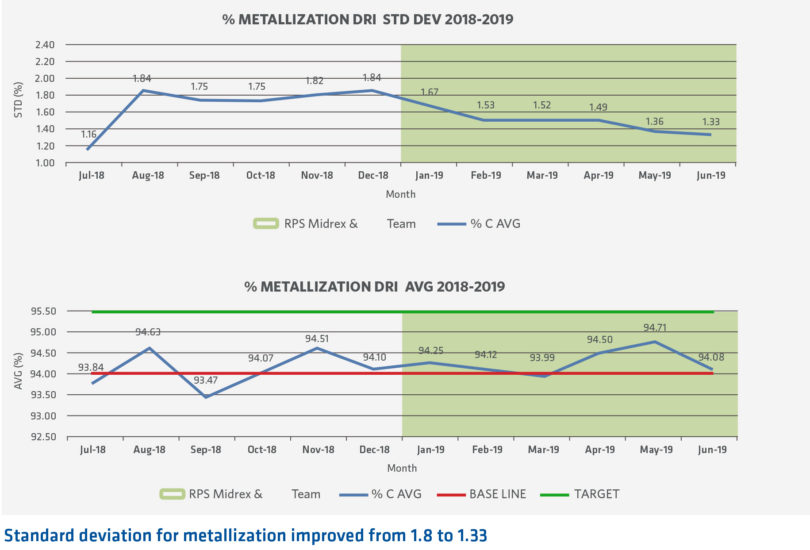
FIGURE 4.
Standard Deviation for Metallization1
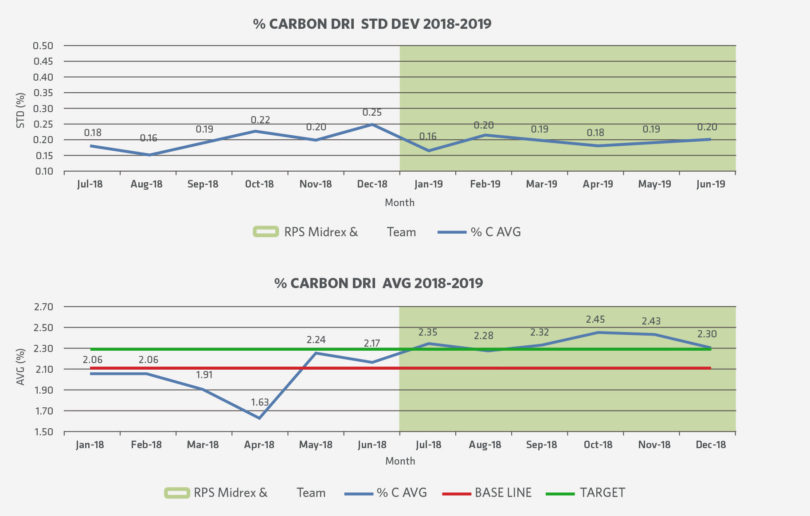
FIGURE 5.
Standard Deviation for Carbon1
STEP 3 - MAXIMIZING THE METALLIZATION
In an attempt to reduce electrical consumption in the EAF, the metallization in the DRI was not only stabilized but increased. There was an increase in NG consumption in the DR plant to achieve this, but it should be noted that part of this increased consumption really was necessary to achieve the required operational stability in the reformer and furnace to achieve a more consistent product quality. Higher and more consistent metallization would likely reduce the melt shop’s electrical consumption, tap to tap times, and EAF refractory consumption.
For the case study, the EAF was already charging DRI, so there was no significant increase in slag.
STEP 4 - INTRODUCING LUMP ORE
Once the plant was stable, lump ore addition was increased gradually in 5% increments every 72 hours, adjusting the process as required. The following parameters were monitored by the Midrex RPS team with each increase:
- Bed temperatures – check that there are no symptoms of gas channeling in the furnace.
- Top gas CO2 to be held between 18-20% – indicates the reduction is as expected.
- Top gas temperature – same as above.
- Adjusting burden feeder speeds as the feed mix density changes.
- Observe burden feeder behavior – burden feeder pressures.
- Upper and lower seals – additional fines can cause lost seals.
- Quality.
- Fines in water system – from top gas duct.
Financial Impact – Introducing Lump Ore
There are several factors to consider when deciding on the feed mix for an EAF. Some examples are.
- The quality of steel to be produced. This plays a role in determining the amount of virgin iron if any to be added vs available scrap.
- How much copper and other impurities are in the scrap available.
- Use of DRI or pig iron, etc.
- Using/increasing the use of DRI – a DRI with an increase in gangue would require the EAF slag practice to be adjusted. This can result in significant losses in yield.
- Increased fines generation in the DR plant will reduce yield in the DR plant and in the EAF (fines may not be able to penetrate the slag, resulting in yield loss in the feed material).
SERIES SUMMARY
In summary, substituting the feed material in a DR Plant is a lot more complicated that just calculating the price difference between the raw material available to that plant. It should encompass the operation from receiving the raw material to the final liquid steel.
In this study, the EAF was already being charged with a set percentage of DRI. The objective here was to increase the high-grade lump ore portion in the DRI makeup. This would help counter the iron oxide pellet shortage and reduce material cost in the DR plant feed material by eliminating the premium. It was assumed that replacing the DR-grade pellets with a high-grade lump ore with similar chemical properties would not have a significant effect on the slag practices or losses in the EAF.
In this example:
- Lump ore feed increased from 3% to 25% – an increase of 22% in lump ore translates to a substantial material savings
- There was a NG/t increase. This was to:
- Stabilize the plant quality – reduce standard deviation (part of this increased consumption was required regardless of the lump addition to achieve stable operation prior to increasing lump in the feed mix).
- Increase metallization – to reduce EAF electrics/tap to tap times/reduce refractory
- Increased metallization and more consistent quality translated to a saving in the steel mill by:
- Electrical saving in the arc furnace
- Electrode saving – by reduced tap-to-tap and reduced power consumption.
- Shorter tap-to-tap times result in higher productivity
References:
[1] Midrex RPS
Related Reading
 Jun 15, 2026
 Mar 25, 2026